An atmospheric river brings heat and rain… again
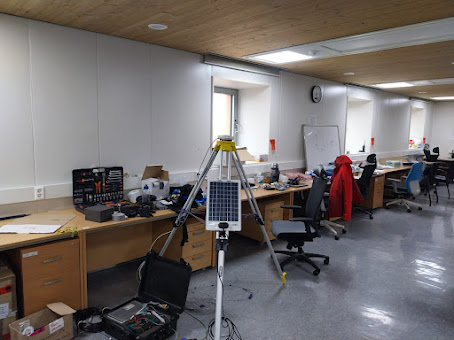
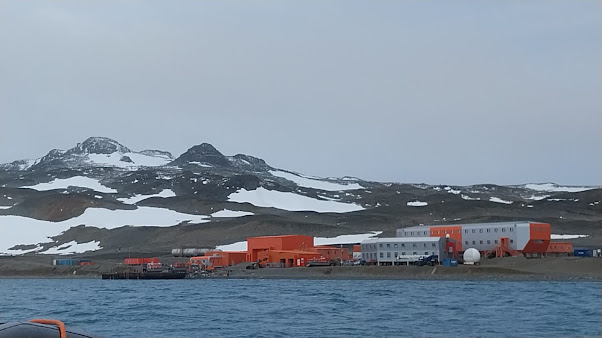
Our first days at King Sejong were quite intense. Arrival afternoon of 1 February, we were checking out equipment, unpacking cargo, installing radiosonde ground station and did the first radiosonde launch already on 2 February evening at 21h local time (00UTC). Thanks for the help to Taejin, Won Soek and Minghi!
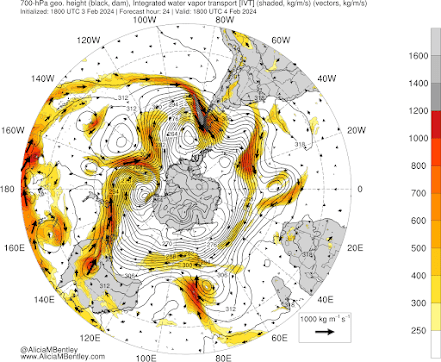
It was a good “warm-up” because on 4 February we had an atmospheric river scale 3 landfalling in the northern Antarctic Peninsula. We use “AR scale” to measure the strength and duration of atmospheric rivers – a bit like for the hurricanes. AR scale 3 means that vertically integrated (through the entire troposphere) moisture transport reaching the Antarctic Peninsula coast was above 500 kg per meter per second (moderate strength for mid-latitudes and quite intense for the polar regions!) during more than 48 hours. You can learn about the AR scale here.
Figure: Image of an atmospheric river: colors and black arrows show integrated water vapour transport (see the narrow and strong transport of moisture from Pacific Ocean towards southern South America and then turning to the Antarctic Peninsula) and black lines – 700hPa geopotential height (showing a deep cyclone west of the Antarctic Peninsula). Based on GFS. Figure source: aliciambentley.com
And then during three days we had the fun of launching meteorological balloons at 15 m/s wind speeds (with gusts up to 25 m/s)… Quite an exercise I should say. Or sometimes a danceJ Be prepared also for the failures because the balloon doesn’t go up right away in this wind but can do twists and turns, and can go horizontally, or up and down before starting its ascent...
Photos: Irina and Claudio launching radiosondes in high winds. photo ©Yosvany Garcia
In the end it is rewarding as the data are very important. We can see the layers of strong warm and moist air intrusion, low level jets and clouds. These insitu observational data are key to estimate how anomalous the entire troposphere (from the surface up to 8-10 km) becomes during the atmospheric river events. We use these in situ observations for model evaluation. And to understand how these changes impact precipitation formation and surface melt. This event that we measured was very warm with near-surface temperature rising more than 10ºC… Not beating the record-warm event of February 2022 but still very warm. The iceberg that has been around King Sejong for more than a month started to melt fast during this warm event..
Photo: “Our” iceberg in the Maxwell Bay grounded near King Sejong station. photo ©Irina Gorodetskaya


Comments
Post a Comment